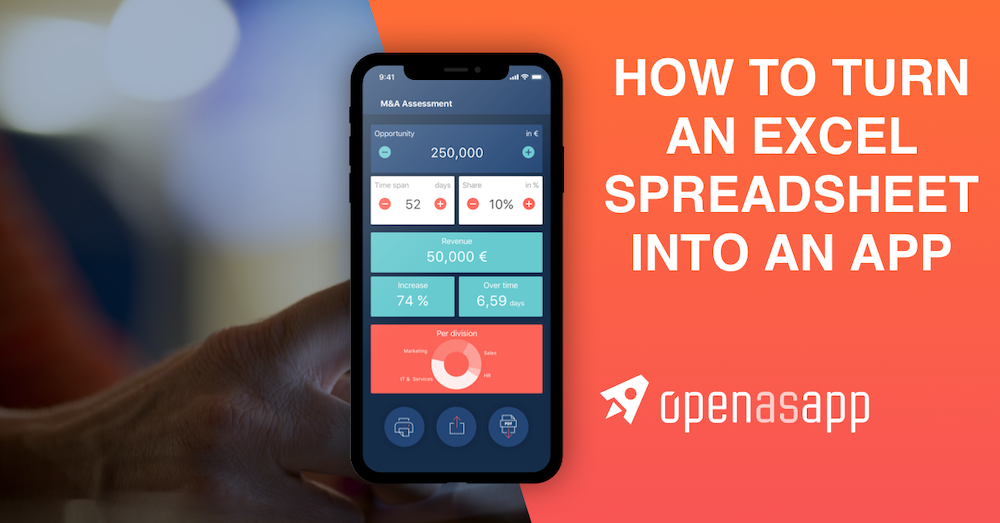
Learn in this step-by-step guide how you can turn a powerful excel dashboard used by venture capital companies to evaluate startups, into a financial plan app within minutes.

Damian Roller
Guides
At Open as App, we regularly like to challenge ourselves and put the platform to the test, to see how far we’ve gotten and what we can improve further. In that spirit, we recently decided to test the Open as App platform with a very difficult startup evaluation spreadsheet by Christoph Janz from Point Nine Capital. This spreadsheet is well-known in venture capital (VC) circles, serving as a veritable standard for what startup evaluation must include.
Despite the highly complex nature of the spreadsheet, we were pleasantly surprised to see how much the app creation wizard recognized instantly. We found that with some basic knowledge of our app creation platform, a dashboard app could be created from the spreadsheet within only a few minutes.
It is part of Open as App’s mission is to help make app creation simple and available for everyone. Our app creation platform is designed to automatically turn data from sources like Excel spreadsheets or databases into accessible, user-friendly, and highly efficient apps. This includes all sorts of dashboard apps, list apps, calculation apps, and more! No coding is involved in the process, and users only need to visually configure their apps, if they wish, or use one of the templates.
In this current blog post, we have described the process of turning the highly complex startup evaluation spreadsheet into a dashboard app. Keep reading to find out how you can use Open as App for the same purpose!
Before we begin, we’d like to issue a disclaimer about our test. It is important to keep in mind that it is always hard to really understand and dig into someone else’s Excel spreadsheet. What our test was about was to automatically add the main charts of the spreadsheet into an app, and do so in a comfortable way.
If you want to go ahead and do more than that with your own app, you will need to understand the formulas in the spreadsheet and the way the data is organized. Of course, this would take some additional time. That said, let’s proceed with how we created our dashboard app!
Point Nine Capital is a well-known Berlin-based VC firm. They specialize in early-stage startup investments in the field of SaaS, mobile, as well as online marketplaces. Over the years, Point Nine Capital has supported some very successful companies, such as Zendesk, Clio, Typeform, Revolut, and others.
Naturally, for an investor of this proportion, being able to accurately determine the status of a startup, plan its development, or assess the efficiency of its sales model is very important. The spreadsheet created by Christoph Janz of Point Nine Capital serves this exact function.

It is easily the most complex and professional SaaS startup financial plan out there. Its general structure includes a tab that summarizes the calculations from the rest of the sheet, as well as separate tabs for revenues, costs, a sales team hiring plan, and a tab with all charts in one place.
In detail, each tab includes “assumptions” about the operation of the company which contains the input fields, on the basis of which calculations are made in the sheet. For example, fields in the Revenues tab include values such as signups, customers for different payment plans, and cash inflow. The Costs tab includes fields such as general and administrative costs (G&A), research and development (R&D), marketing, sales, customer success, staff-related costs, and others.
Naturally, this type of financial plan is best created in a spreadsheet. Excel provides the perfect environment and capabilities to pull all of these different aspects of a financial plan together. This is a spreadsheet for experts. Of course, this also makes it hard to understand. Factors that make the spreadsheet difficult to use include:
For an expert, all of this may not be an issue. Yet, there are ways in which the spreadsheet can be made much easier to understand while retaining all of its depth and detail. This is where Open as App can help by creating an app from the spreadsheet.
Developing a custom app is not easy and it may not be cheap. Price ranges may vary significantly, depending on the complexity of the app. At the same time, a survey about the cost of app creation, conducted by Clutch several years ago, found that “the median cost range is between $37,913 and $171,450, but could climb up to $500,000 or higher.”
In addition to the cost of creating a custom app, the time it takes to develop the app can also be somewhat lengthy. A 2019 survey by Outsystems found that about 49% of mobile apps take 4 months or less to be developed, and 57% of web apps take the same time. Other apps can take longer, upward of 5 months, and for some even above 12 months.
Because of the costs and the time it takes to create an app, many apps are never made even though they are planned. This is also due to the skills shortage in IT which further complicates matters, leading to app development companies, as well as internal IT teams, consistently struggling to meet demand.
In comparison to the above, creating an app from a spreadsheet with Open as App may take as little as 2 minutes, and cost significantly less. Open as App provides users who have ready, structured data in the form of a spreadsheet (or another structured format) to create an app out of that data for a fraction of the cost and time it would otherwise take.
In this way, a no-code app development platform like Open as App can help companies who want to create apps to address some of its projects in an immediate and cheap, yet very efficient and user-friendly way. Some of the immediate benefits of creating an app in this way include:
More specifically, creating a dashboard app from the SaaS Financial Plan 2.0 with Open as App offers some of the following benefits to its users, such as investors and startup founders:
These are some of the ways in which turning Christoph Janz’s financial planning spreadsheet into a dashboard app can be very helpful to both investors as well as startup founders and CEOs. Such an app overcomes some of the downsides of Excel while retaining both the logic of the sheet as well as all associated data.
Going back to the challenge we put up for ourselves, we wanted to see what would happen if we imported the SaaS Financial Plan 2.0 into Open as App. We knew we had really passed a milestone when we saw the platform grasp the logic of the spreadsheet and import most charts into the app with no additional input apart from the standard steps required for app creation.
Naturally, for a beginner, this process may not seem so simple and easy, because they are not used to working with the platform. But given how well this spreadsheet is formatted and put together, it requires very little input on the side of users to create a dashboard app from it.
If you’d like to try creating this app yourself, download the financial plan spreadsheet, import it into the Open as App wizard, and follow the steps that follow. Alternatively, if visual cues are better for you, see the video below for a quick step-by-step walkthrough.
Follow the steps below to create your own dashboard app, based on the spreadsheet by Christoph Janz.
1. Data import and analysis
Begin by importing the financial plan spreadsheet into the Open as App wizard and let the platform analyze the file. The Data analysis screen will then show up.
Here you are given the option to double-check if the platform has analyzed the data correctly. On the left-hand side, you will see a list of the various elements that the wizard has found in the sheet, such as charts, lists, print definitions, and more.
You can click on each element type to double-check if these have been correctly spotted by the platform. If a chart that you want to include is missing, you may want to double-check your spreadsheet to determine if there isn’t an error there.
If all of the data in the spreadsheet has been correctly found, you can proceed to the next step.

2. Select the app type
In this step, you are asked to determine what type of app you would like to create. The wizard will typically suggest the proper app type but you can also choose to do something else.
The proper app template for the dashboard app is “Charts”.

3. Select the charts you would like to include in the app
You will then be asked to determine which charts from the original spreadsheet you would like to import into the app. Depending on the type of app you want to create, you can pick one or all of the charts.
Assuming that you want to create a dashboard app that covers the whole spreadsheet, click on “Import all charts” in the upper right-hand corner.
These will then appear in the app prototype on the left, where you can already change the order of the charts or, if you determine you want to do something else, delete individual charts which you want to exclude from the app.
By clicking the “pencil” icon on a chart, you are also given the option to configure the chart, such as its type, caption, chart legend, visual style, and more. Keep in mind that even if you don’t edit a chart at this stage, you can always do this later!

4. Determine your app design
At this step, you can pick a particular visual app design that appeals to you. Open as App will suggest various app design templates from which you can choose.
You can also simply click “Next” to stick with the basic app design or in order to edit the design and colors on your own at the next step.
5. Customize your app
This is the final step before you publish your app. This step continues the design and customization stage. Here you are given all possible options about configuring your app.
At this stage, you can add new cells or charts to your app, or format already existing elements. You can add various types of action buttons – such as a print button if your spreadsheet has a print functionality – and more.
If you didn’t pick a specific app design earlier or if you’d like to change the colors of your app, add background images and more – all of this is also available to you here.

6. Publish your app
This is the last step of the app creation process. Here you give your app a name and add a description.
You can then test the app on your own device, through the Open as App client as well as share the app with other users. Congratulations on creating your first dashboard app!

Get an overview of how simple and fast it is to create the financial plan dashboard app in this short tutorial video.
Download the SaaS Financial Plan spreadsheet and give it a try! Alternatively, if this seems too complicated or you’d just like to try something else – try using the sample “Startup reporting” data, available in our app creation wizard, or check out interesting apps in our app catalog.
Finally, if you’d like to work with data you are already familiar with, use one of your own spreadsheets! Don’t worry, Open as App will never save your data, so you are free to experiment with your spreadsheets as much as you want.

Alexandra Müller

Alexandra Müller

Alexandra Müller

Alexandra Müller
Borislav Kiprin

Alexandra Müller

Alexandra Müller

Alexandra Müller

Alexandra Müller
Open as App GmbH
Amalienstraße 62, 80799 Munich
info@openasapp.com | www.openasapp.com | +49 (89) 2620417-00


@2023 Open as App GmbH